See

Money Maker

Video
  • Investment in Equity Market
    Investment in stock market is risky by nature but by far the most rewarding market for an investor. Let us guide you through historical evidence of returns through equity investing. The following table shows the returns (average, minimum and maximum) for different holding periods carried out since creation of Sensex till year 2010.

    EQUITY RETURNS

    Holding Period (yrs) Average return (%) Min Return (%) Max Return (%)
    1 25 -47 267
    5 19 -5 53
    10 17 -2 35
    15 18 12 27
    20 17 14 20
    25 18 17 19

    Source: Sensex returns from beginning till 2010

    What it shows that for shorter duration of equity investment, the minimum and maximum returns vary widely however longer you hold equity investment, the difference in minimum and maximum returns reduces and provides stable returns. This means it rewards the long-term investor with handsome average returns.
  • Types of Investors
    Long Term Investors - Timeframes vary from person to person but generally investors who have investment time range of 5 years and above are considered long term investors. Short Term Investors - Normally investors with investment holding time range of 1 to 4 years are considered short-term investors. Traders - Are those who hold investment for less than a year.
  • Why equity benchmarks are important?
    Equity benchmarks represent the unified view of large industries of any country. Two major indexes of Indian equity are Sensex (Designated 30 large capital stocks) and Nifty (Leading 50 diversified industry stocks). Whether the benchmark is Dow Jones, FTSE, CAC, DAX, or Nikkei, these benchmarks in a way indicate the economic state of any country and help any outsider compare the investment returns viz-a-viz other countries.
  • How to find quality money making stocks?
    There are many ways to find quality stocks such as reading and analyzing annual reports of the companies or doing technical analysis. Even after spending such time, finding quality stocks does not mean it makes you money. Neither you have time nor resources to find and chase the market on daily basis. MySmartStocks.com is your answer - without much resources of yours, you simply visit MySmartStocks.com and punch in your own parameters to find those winning stocks. MySmartStocks.com allows you to define your own analysis time range and comparison time range to separate quality money making stocks.
  • How to control and select stocks?
    There are two controls MySmartStocks.com provides-
    • Stronger than Sensex
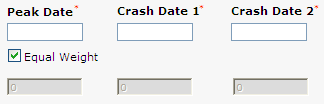
      Stronger than Sensex - Survival is one of the foundations of MySmartStocks.com to consistently detect only those winning stocks during market peaks and crashes. 
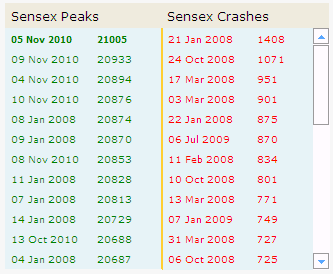
You select proper Sensex peak date and two crash dates where you find survival very important for your financial health. We provide you with such historic dates from Jan 2008 to select from. Stronger than Sensex Stronger than Sensex
    • Quality filter
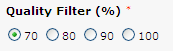
      Quality filter – Performance is another foundation of MySmartStocks.com to separate winners from the laggards. Higher the number, higher the quality and smaller number of winning stocks. Quality filter Based on your Survival and Performance parameters, there are many reports that users can benefit from and accordingly invest in winning stocks.
  • Are you a Wise Investor?
    There are three essential things a wise equity investor needs to do- a) Periodically monitor his/her portfolio b) Take desired profits c) Reshuffle the holdings as necessary By regularly visiting MySmartStocks.com, investors can stay with the pulse of the market and their equity investments.
  • MySmartStocks.com User Guide
    • Report selection
      MySmartStocks.com offers many reports based on investor requirements. Default - Investor looking for quality Stronger-than-Sensex stocks with MySmartStocks.com ranking would find them useful set of stocks. Momentum Leaders : Average Return - For medium or long term investors looking for stocks that beat Sensex in average return during their comparison timeframes Momentum Leaders : Widest Margin - For long term investors looking for stocks that have beaten Sensex by widest margin during near-term and long-term comparison Momentum Leaders : Growth Engine - A perfect choice for traders or even long term investors looking for stocks with consistent and aggressive growth mode over last 12 months
    • Analysis Time Range
      There are two factors that primarily determine the candidature of winning stocks. i) Time Duration for analysis ii) Selection of Dates (market peak and crashes) Longer you hold your equities, better you are rewarded as evidenced in Investment in Equity Market. Similarly, you should keep longer analysis time range. Considering the formation of fast economic events and their applicability, take 2 to 3 years of duration for such analysis.
      Selection of ACTUAL market peak and crash dates are very important. People feel very positive and full of energy when market reaches high levels however they refrain from expressing their monetary (or paper) losses when market dives. In fact, these good or bad dates are indicative of something very eventful occurring domestically or globally. It is important to make money in equity investment but far more important to survive better than other investors in bad times. Therefore, this understanding should be reflected in your choice of peak and crash dates. Upon analysis and your choice of importance of dates, they determine Stronger-than-Sensex stocks for you. You will find few examples of these dates in FAQs. There are many market peak and crash dates listed on the screen. For example, If you are analyzing on January 31, 2011 and *  selecting Peak date = 10-Jun-2009, Crash Date1 = 20-Nov-2008 and Crash Date2 = 24-May-2010, you are getting Analysis Time range of over 2 years oldest of (peak, crash1, crash2) 20-Nov-2008 till 31-Jan-2011 *  selecting Peak date = 1-Jan-2008, Crash Date1 = 24-Oct-2008 and Crash Date2 = 24-May-2010, you are getting Analysis Time range of over 3 years oldest of (peak, crash1, crash2) 1-Jan-2008 till 31-Jan-2011
    • Weightage to dates
      For an advanced analysis we also provide investor to select different weights for different peak and crash dates. You may want to refer to the Sensex behaviour over last three years to better decide along with economic events that were associated with such behaviour. For example, you realized crash date2 you chose when official high inflation numbers were published and market went bad vs. crash date1 in October 2008, you may feel to assign 50% weight to crash date1, 25% weight to crash date2 and 25% to peak date. What this means to you that you are now analyzing the BSE and NSE stocks by giving higher importance to recovery from October 2008 in relation to other dates for finding winning stocks.
    • Quality Filter
      Another important foundation of MySmartStocks.com is to separate winners from the laggards. Only consistent performance above and beyond Sensex performance over your chosen analysis time range is the key for finding winning stocks. Higher the number, higher the quality and smaller number of winning stocks. Based on your Analysis time range and Quality parameters, there are many reports that you can benefit from and accordingly invest in winning stocks.
    • What-if comparison range
      By now you have chosen your own Survival and Performance parameters for MySmartStocks.com to determine winners. What's More? The best help MySmartStocks.com provides to the following set of investors 1. Sincere investors 2. Young generation with flourishing income but no investment experience 3. People ambitious for equity investment but no direction 4. Even best analytical minds for them to exercise and find out not only those winning stocks but also how those winning stocks would have rewarded them as investors in their own comparison time range. Enter the desired time range for your what-if comparison of those winners and see the results yourself in the reports. MySmartStocks.com gives you the fruits of your analysis right in your hands by way of many reports rather than tips or syndicated or biased information for you to start benefiting from. Good Luck!
    • When should I invest?
      Simple answer to this question is when you have disposable cash that you are willing to grow for your future by taking calculated risk. While you are ready with your reports, you are ready to invest. As an additional benefit to our members, upon login to MySmartStocks.com, we provide short term market guidance for members to act cautiously or enter the market where necessary in order to protect from risk or benefit from the weakness. The following examples are self-explanatory,